AMD: OCT Findings & En Face Correlation
Age-related macular degeneration on OCT. Drusen, RPE changes, geographic atrophy, and early CNV detection with en face correlation.
AMD: OCT Findings & En Face Correlation
Age-related macular degeneration is the leading cause of irreversible vision loss in adults over 50. OCT has transformed how we detect, stage, and monitor AMD — and en face imaging reveals the full geographic extent of disease that B-scan alone consistently underestimates.
Dry AMD: The Drusen Foundation
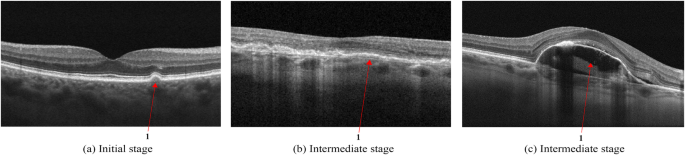
Drusen are deposits between the RPE and Bruch's membrane. On B-scan, they appear as sub-RPE elevations — the RPE is lifted, creating an irregular baseline. Their characteristics carry prognostic weight:
| Drusen Type | Size / Appearance | OCT Feature | Clinical Risk |
|---|---|---|---|
| Hard drusen | <63 μm, discrete | Small, sharp sub-RPE bumps | Lower risk |
| Soft drusen | >125 μm, confluent | Broad, indistinct margins | Higher progression risk |
| Drusenoid PED | Large confluent | Mound-shaped RPE elevation | High risk — monitor closely |
| Reticular pseudo-drusen | Inner surface deposits | Subretinal material above RPE | Very high progression risk |
Geographic Atrophy (GA)
GA represents complete loss of the RPE, Bruch's membrane, and overlying photoreceptors. On B-scan, the key features are:
- RPE loss: The bright RPE band disappears — enhanced light transmission to the choroid creates a characteristic "choroidal hypertransmission" (brighter choroid beneath the atrophic zone)
- EZ disruption: The ellipsoid zone is absent or severely attenuated over the atrophic area
- Outer retinal thinning: ONL and photoreceptor layers thin and eventually disappear
- Junction zone: At the GA border, you can often identify a "junctional zone" where EZ is intact but transitioning
En face imaging at the RPE slab transforms GA assessment: the atrophic area appears as a bright, well-demarcated zone (enhanced choroidal signal through absent RPE). This gives you an accurate lesion area measurement that drives monitoring frequency and trial eligibility decisions.
Wet AMD: Choroidal Neovascularization
CNV represents growth of abnormal vessels from the choroid through Bruch's membrane. On B-scan, the presentation depends on CNV type:
| CNV Type | Location | B-scan Features | Treatment Urgency |
|---|---|---|---|
| Type 1 (occult) | Sub-RPE | Irregular RPE elevation, fibrovascular PED | High — active leakage |
| Type 2 (classic) | Sub-retinal | Hyperreflective fibrovascular tissue above RPE | High — rapid vision loss risk |
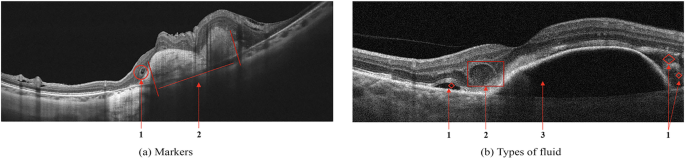
| Type 3 (RAP) | Intraretinal | IRF + SRF + PED triad; neovascularization grows downward | High |
| MNV (quiescent) | Sub-RPE | Flat fibrovascular PED, no fluid | Monitor — treat when active |
En Face Correlation: The AMD Advantage
En face views at the RPE and sub-RPE slabs are game-changers for AMD:
- RPE slab: Drusen appear as bright spots against the normal RPE. GA appears as areas of very bright choroidal signal (transmission defect). Reticular pseudo-drusen form a distinctive reticular pattern.
- Sub-RPE / Bruch's slab: Type 1 CNV shows as a lacy, irregular bright lesion. Drusenoid PED shows as a large confluent bright area.
- Outer retina slab: Photoreceptor loss over atrophy creates characteristic dark (low reflectivity) zones that map the functional loss area.
AMD Monitoring Protocol
- Intermediate AMD (medium drusen only): Annual OCT minimum; consider 6-month if soft drusen, RPD, or drusenoid PED
- Advanced dry AMD / GA: Every 6 months — monitor for wet conversion. GA growth rate ~1.7 mm²/year average but highly variable
- Treated wet AMD: Follow your treating retinologist's protocol; typically monthly initially, then T&E or PRN
- Fellow eye with wet AMD: 25–50% 5-year fellow eye conversion risk; minimum every 6 months
Key Takeaways
- Drusen type and size predict progression risk — soft drusen and RPD carry the highest risk
- GA shows as choroidal hypertransmission on B-scan; en face gives accurate lesion area
- CNV type (1, 2, 3) guides treatment urgency and expectation of response
- Always assess the en face RPE slab — B-scan alone underestimates disease extent
- Fellow eye of wet AMD needs minimum 6-month monitoring
Educational illustration — Dry AMD B-scan pattern: sub-RPE drusen deposits (amber) with overlying EZ disruption and RPE elevation. Real clinical scans in full course.
Sign up to track your progress and access all lessons.
Create Free Account