Diabetic Retinopathy: OCT Assessment
DME detection, hard exudate mapping, and early ischemic changes visible on OCT before they appear on fundus exam.
Diabetic Retinopathy: OCT Assessment
Diabetic macular edema is the leading cause of vision loss in working-age adults worldwide. OCT is the gold standard for DME detection, monitoring, and treatment response assessment — finding fluid accumulation that's invisible on clinical exam.
DME Patterns on OCT
Not all DME looks the same — the fluid pattern has clinical and prognostic implications:
| DME Pattern | OCT Appearance | Visual Prognosis | Typical Response to Anti-VEGF |
|---|---|---|---|
| Diffuse thickening | Retinal thickening without distinct cysts; spongiform appearance | Variable | Good |
| Cystoid spaces (CME) | Distinct hypo-reflective spaces in ONL/INL; "Swiss cheese" on en face | Good if EZ intact | Good |
| Subfoveal SRF | Fluid between EZ and RPE | Worse if chronic | Moderate |
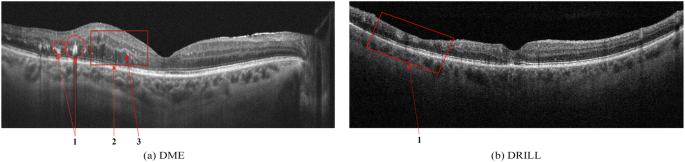
| Disorganized inner retina (DRIL) | Loss of distinct layer boundaries in inner retina | Poor | Limited |
| Hard exudate deposits | Hyperreflective foci with posterior shadowing | Poor if subfoveal | Slow/poor |
The EZ Band: Your Most Valuable Measurement
In DR, the ellipsoid zone is the best single indicator of photoreceptor health and visual prognosis:
- Intact EZ: Good functional reserve, favorable prognosis even with significant edema
- Disrupted EZ: Photoreceptor damage — vision may not recover even if fluid resolves
- EZ disruption length: Measured in μm at the foveal center; >500 μm disruption predicts poor visual acuity outcomes
Hyperreflective Foci (HRF) in DR
Small, bright dots throughout the retina in DR represent several pathological processes:
- Migrating RPE cells (in later DR)
- Precursors to hard exudate crystalline lipid deposits
- Inflammatory microglial cells
- Lipid-laden macrophages
HRF in the outer nuclear layer predict progression to hard exudate deposits and are associated with worse visual outcomes. HRF count and distribution is an emerging biomarker for DME severity.
DR Staging on OCT: Beyond the Fundus Exam
OCT changes DR staging in two critical ways:
- Subclinical edema detection: Central subfield thickness (CST) >305 μm in men or >290 μm in women (Zeiss Cirrus thresholds) defines center-involving DME — regardless of what you see on slit lamp. The OCT finding determines treatment eligibility, not the clinical appearance.
- Ischemia assessment: Inner retinal thinning on en face imaging correlates with diabetic ischemia (non-perfusion). Areas of inner retinal atrophy on structural en face often correspond to non-perfusion zones on OCTA.
En Face DME: The Cyst Map
On en face imaging at the inner retinal slab (spanning ONL and INL), cystoid DME produces a characteristic dark-on-bright pattern: cysts appear as dark holes against the brighter retinal background. En face gives you:
- Total cyst volume (better than CST alone for treatment monitoring)
- Geographic distribution of fluid — central vs. paracentral pattern
- Asymmetry that predicts which area will respond first to treatment
DME Monitoring Protocol
| DR Severity + DME Status | OCT Frequency | Action Threshold |
|---|---|---|
| Mild/Moderate NPDR, no DME | Annual | CST increase >10% from baseline |
| Severe NPDR, no DME | Every 3–4 months | Any new fluid |
| Non-center-involving DME | Every 3 months | Progression toward center |
| Center-involving DME (untreated) | Monthly until stable | Refer for treatment |
| Active treatment | Per protocol | Per DRCR protocols |
Key Takeaways
- OCT detects DME before funduscopy — rely on CST measurements, not clinical appearance alone
- EZ band integrity is the most important predictor of visual outcome in DME
- DRIL (disorganized inner retina) predicts poor functional recovery
- En face inner retinal slab maps cyst distribution and volume beyond CST alone
- HRF in the outer retina predict hard exudate deposits and worse prognosis
Educational illustration — Diabetic Macular Edema: intraretinal fluid cysts (blue) with hyperreflective foci (amber). Real clinical scans in full course.
Sign up to track your progress and access all lessons.
Create Free Account